“If you can’t measure it, you can’t improve it.” (Peter Drucker)
That is the truth that drives us to collect and analyze data. Online and offline, we gather data that tells us things like how many people clicked, where they navigated to, and what they searched for. We use this analysis to measure the effectiveness of our products, services, and designs.
In this guide, we’ll look at how you can get started with your data to create analytics for making the right decisions.
1. Define Your Metrics — Ask The Right Questions
Analytics is overwhelming. It’s easy to track a bunch of different metrics and call it a day. Don’t do it! Instead, focus on learning about your users and let those questions determine what metrics to track.
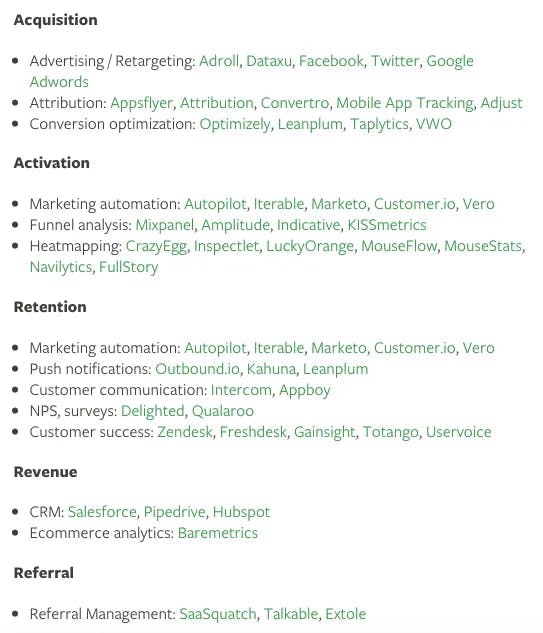
Example: Focusing on conversion instead of awareness means tracking the critical parts of your funnel.
Then, settle on a single “North Star” metric (thanks to Sean Ellis for the term!)that aims to encapsulate the growth of your business. This metric should be a rate, such as sign-ups per week, rather than a total because rates can answer questions like “Did our marketing efforts succeed last week?”
Lastly, make sure your metric has a time-bound goal. This will rally your team to prioritize your tasks ruthlessly to achieve it.
Good sources: How to think about analytics by Segment; Choosing metrics that matter by Segment, How do I analytics by 500 Startups
2. Set Up Your Tracking Plan & System
The best companies approach analytics with rigor and front-load the planning for implementing tracking by creating a Tracking Plan. This plan helps clarify what events to track, where those events need to go in the code base, and why those events are necessary from a business perspective.
![]()
Tracking plan is taken from Diana Smith’s talk on measuring B2B engagement.
Good sources:What is a tracking plan and why should you care by Segment,How to create a tracking plan by Segment
3. Define A Naming Convention & Don’t Forget To Tag
Code that adheres to a style is easy to read. Likewise, events that follow a standard naming convention are easy to analyze.
A standard naming convention will bring:
- Consistency: the same event names in every tool makes it far easier to analyze.
- Convenience: each time you need to add a new event, you don’t have to figure out how to name it.
- Clarity: everyone will understand the event without needing to look at the whole picture.
Segment like to use the “Object-Action” framework. First, choose your business objects (e.g., Song) then define actions your users perform on those objects (e.g., Played). This leads to events like “Song Played” and “Song Paused.”
Good sources: Naming conventions for clean data by Segment, Example UTM naming convention
4. Choose A Growth Stack
Customer data all by its lonesome is not useful. You need to set it up to help you make decisions. That means piping your data to a variety of tools to help you understand, acquire, and engage your users.
First, compile a comprehensive checklist of tool categories. This includes funnel analytics, live chat, email list builders, sales and support tools, paid acquisition, and attribution.
Then, integrate tools at the right moment. Don’t sign up for something without a clear and specific goal in mind. The tool should help you to answer your questions.
Good sources: Navigating the sea of customer data tools by Segment, Tools that early-stage startups need to understand their customers by First Round
5. Interpret Your Results — Reporting
Don’t try to analyze it all — you’ll get lost in data and become discouraged. Instead, narrow your focus to the metrics you have defined in the first step. The following steps can help you effectively interpret your data:
- Understand your business and how these data relate.
- Set up objective hypotheses: always ask what and why is it happening.
- Analyze multiple metrics together: to truly understand how users interact, and what makes them convert, you need to look at how different metrics relate to one another, e.g., Does conversion rate go up as time on the page goes up? Or does average order value increase as pages per visit rises?
- Learn how certain groups of users interact differently: segmenting users will help you leverage what’s working for the high-performing groups as well as expose low-performing groups that you could spend fewer resources on.
6. Adjust Your Strategy — Optimization Method
Make the data and results shareable and accessible! This cuts down on duplicate information gathering and can also lead to improved experiences, greater convenience, and offering customers lower prices.
In addition to knowing your audience, you should be able to adapt your strategy to their shifting needs and desires. If a product or acquisition/ retention channel looks like it’s going to waste time, workforce and money for little return, you should cancel it or change the strategy. React to the customers and your data.
A special thanks to Segment for contributing content and links to this guide!
*This article first appeared on the Headline (formerly eventures) Medium.