Article at a Glance:
⦁ Capital Efficiency compares the speed a business grows vs. the cost to achieve its growth. We use two calculations to evaluate Capital Efficiency.
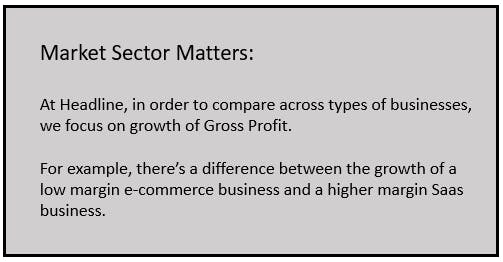
⦁ While Capital Efficiency is a useful metric, in isolation it doesn’t tell the whole story. We also consider the Market Sector when looking at Gross Profit to get the bigger picture, and we look at Annualized Gross Profit over Cumulative EBITDA (Earnings Before Interest, Taxes, Depreciation, and Amortization) to evaluate Capital Efficiency vs. traction over time.
⦁ We don’t analyze this metric on a cumulative basis. Instead, we look at it over time on a period-to-period basis. At Headline, we prefer using a quarter-to-quarter basis because it provides enough fidelity while reducing the noise associated with monthly granularity.
⦁ To identify Best in Class, we target companies with ratios of these two metrics over 0.5. Looking at these on a cumulative basis is helpful, but we prefer to analyze on a quarter-by-quarter basis to reveal efficiency over time.
⦁ There are four drivers that impact growth of Gross Profit – new revenue, revenue churn, revenue upsell, gross margin. We calculate Burn/EBITDA to evaluate the change of Gross Profits relative to the change of fixed costs to understand the net effect these four drivers have on the Quarterly Capital Efficiency over time.
Calculating Your Capital Efficiency
Capital Efficiency compares the speed a business grows vs. the cost to achieve its growth. To calculate Capital Efficiency, find the amount that the Annual Recurring Revenue (ARR) changes from one period to the next. Then, divide that by the amount spent during that same time period:
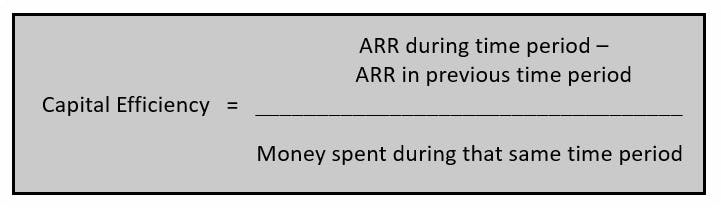
As an alternative, if the business doesn’t have Recurring Revenue, you can evaluate the “Revenue Run Rate.”
Annualized Gross Profit over Cumulative EBITDA
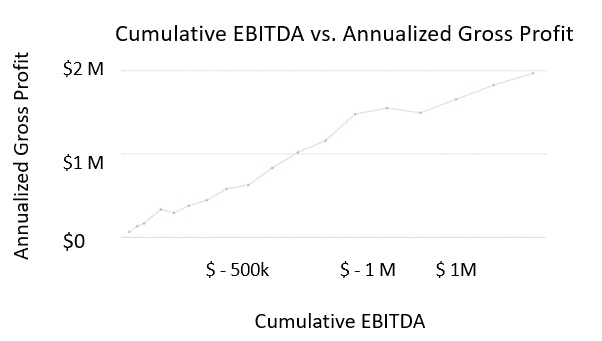
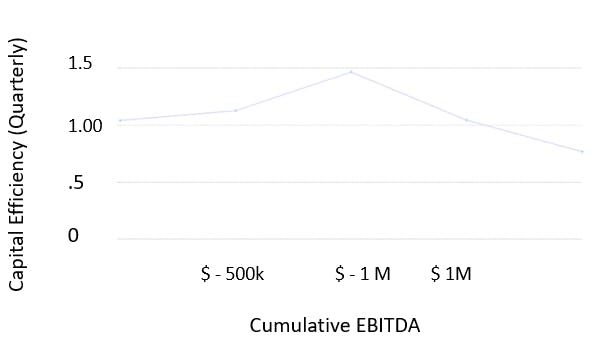
Annualized Gross Profit over Cumulative EBITDA highlights the Capital Efficiency vs. the traction achieved over time.
The chart below shows the Annualized Gross Profit over Cumulative EBITDA. We like this chart because it provides a direct comparison of the amount of money burned with the Annualized Gross Profit generated:
Target Capital Efficiency Ratio: > 0.5
At Headline, we look for companies with a ratio of these two metrics that’s over 0.5. We focus on this because it shows that for every $1 spent, the business should add .5 dollars in Annualized Gross Profit.
The rationale behind this 0.5 target is based on benchmarks of successful companies. For example, a business with $100M of Gross Profit is typically worth $1B. That company generally spent $200M of Capital to get there, which is 0.5 in Capital Efficiency. As a result, 0.5 is a great benchmark for venture businesses.
More Fine Tuned: How to Calculate Quarterly Capital Efficiency
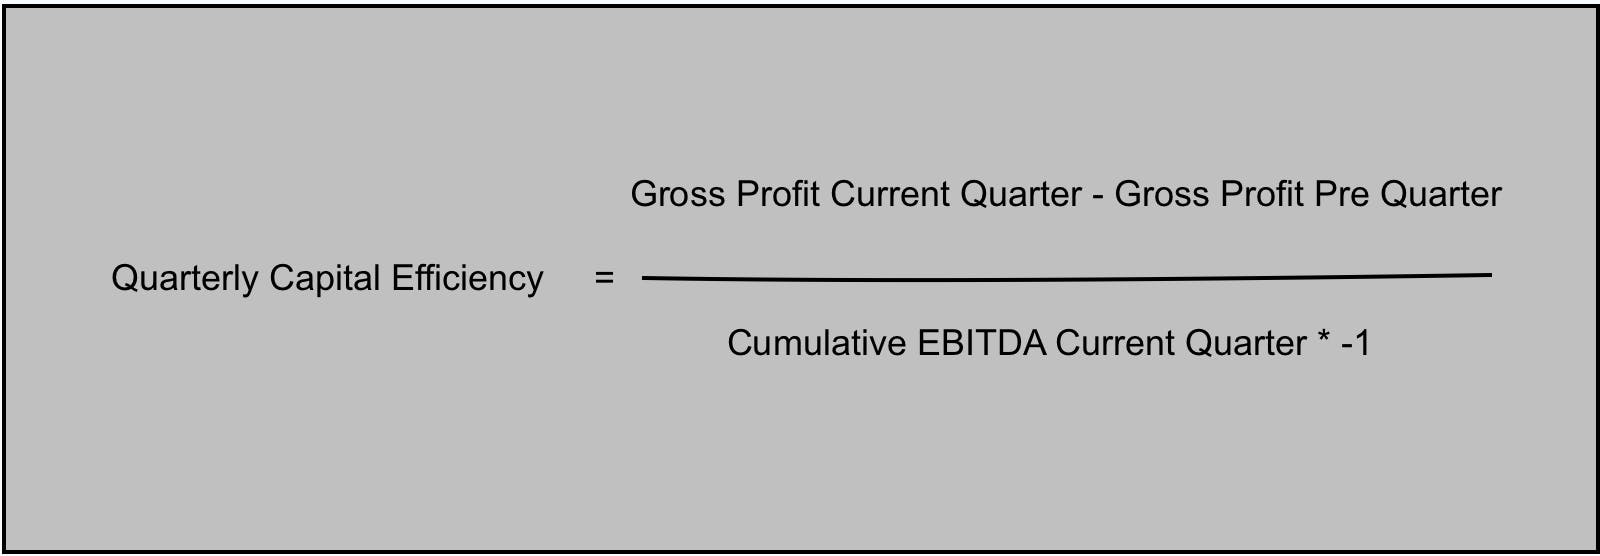
A deeper way to analyze this metric is not on a cumulative basis over time, but instead on a period-to-period basis. At Headline, we prefer using a quarter-to-quarter basis because it provides enough fidelity while reducing the noise associated with monthly granularity. This is a consideration because so few businesses consistently grow Gross Profit each month.
To calculate this, we calculate the growth of Gross Profit from one quarter to the next, multiply that difference by 12 to annualize it. Then, divide this by the burn for the quarter:
Best In Class Target
By mapping these quarterly data points over time, we can more easily see whether a business is becoming more or less Capital Efficient over time. In order for a business to be considered “Best In Class,” this metric must be greater than 0.5, indicating that it brings in more than $1 of Gross Profit for each $1 invested to gain that dollar.
Below is an example:
Changes In Capital Efficiency: What Impacts Your Ratio?
As mentioned above, Capital Efficiency is the speed at which a business grows versus the investment made to achieve this growth. It’s calculated by dividing the Annualized Gross Profit for a given period of time by the total EBITDA over that same period.
There are two reasons this metric may change from one period to the next:
- Gross Profit is growing faster than the business is burning money
- Gross Profit is growing slower than the business is burning money
Four Drivers that Impact Growth
There are four drivers that impact the growth of Gross Profit:
1. New Revenue
For this first driver, we compare two changes in revenue. We look at the change in revenue during the current period, and compare it with the change in revenue during the previous period.
This comparison of two changes helps us see trends that we can’t understand when looking only at total revenue.
2. Revenue Churn
For this driver, we’re comparing the churn in this period with the churn from the prior period.
Decrease in churn supports growth in revenue.
3. Revenue Upsell
Upsell refers to revenue generated by upgrading current customers.
For this driver, we compare the change in Revenue Upsell in the current period with the prior period.
An increase in Revenue Upsell supports growth in revenue.
4. Gross Margin
Gross Margin measures profitability.
We look at Gross Margin for the current period and compare it to the prior period.
An increase in Gross Margin supports growth in revenue.
Fuel Efficiency of a Startup
A car analogy can help illustrate why Capital Efficiency matters. There are steps a driver can take before leaving on a trip and strategies he can use while driving to improve his fuel efficiency. For example, he can remove heavy items to make his car lighter and pump up his tires to the optimal pressure to reduce resistance on the road. While driving, he can cruise at a consistent speed, rather than driving erratically.
Similar to driving, there are strategies to use Capital Efficiently to avoid running out of this “fuel.” Let’s say your objective for your business is to increase Gross Profit from $0 to $100M+. Then, the question you’ll need to address is how much capital does your business need to accomplish this objective. You also want to make this capital last longer on your journey to avoid going back to investors for more money and consequently diluting ownership.
To do this, we look at how much a business spends vs. how much it grows by evaluating the ratio of Burn/EBITDA (Earnings Before Interest, Taxes, Depreciation, and Amortization) - more about this below. We also look at how this ratio changes over time.
When you raise capital, you increase the number of shares outstanding. As a result, each stockholder owns a smaller percentage of the company. This dilution makes each share less valuable. As a result, minimizing dilution is key to maximizing the share value.
The more efficient a business is at burning capital, the less money it needs to achieve its objectives. Raising less money reduces dilution. This is beneficial for shareholders, which includes the founders. Investors and employees with stock options also value companies with less dilution because it increases the value of their ownership at a liquidation event.
Businesses with higher capital efficiency are less diluted. Compare this to startups with poor or low capital efficiency that require additional rounds of funding, which increases dilution.
As a result, a business with high capital efficiency and lower dilution is valued more than a business with poor capital efficiency and high dilution.
Monitoring Changes In Your Capital Efficiency
In addition to using the calculation outlined above to evaluate the growth of Gross Profit, we also use the ratio of Burn/EBITDA.
This ratio evaluates the relative change in Gross Profits in comparison to fixed costs for the same period.
We then compare this change to the change in previous periods.
Below is an example of what quarterly Capital Efficiency changes looks like in Deepdive:
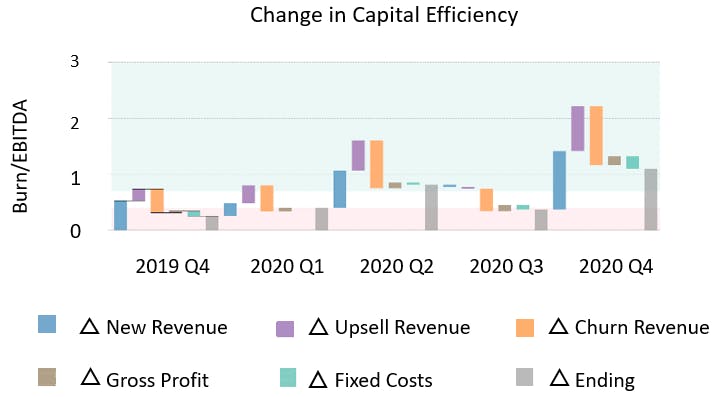
This breakdown helps us understand how Quarterly Capital Efficiency (i.e. gray bars) changes as a function of the increases and decreases of its components:
- New Revenue (blue bars)
- Upsell (purple bars)
- Churn (orange bars)
- Gross Margin (brown bars)
- Fixed Costs (green bars)
- Ending: Capital Efficiency Net Ending Value (gray bars)
Let’s look at an example to illustrate the importance of understanding the impact of each component, rather than simply looking at aggregate totals. In the chart above, showing that the increase in Capital Efficiency from 0.48 in Q3 2020 to 1.1 in Q4 of 2020 was driven by the net effect of the following factors:
Increases in Capital Efficiency were proportionally higher:
- New Revenue (blue bars)
- Revenue Upsell (purple bars)
- Gross Margin (brown bars)
Decreases in Capital Efficiency:
- Revenue Churn (orange bars)
- Fixed Costs (green bars)
Net Effect: Revenue Churn and Fixed Cost both increased throughout the quarter, which decreased Capital Efficiency of the business. However, the business also acquired a greater amount of New Revenue, managed to drive more Upsell, and increased the Gross Margin compared to the previous quarter.
The combined net effect of these factors increased Capital Efficiency from 0.5 in Q3 to 1.1 in Q4.
This means that although the business increased Expenses and experienced more Revenue Churn, it was able to accelerate new user growth and customer upsell, while expanding Gross Margin.
Overall, this increased Capital Efficient from Q3 to Q4, and grew Gross Profit proportionally more in comparison to how much Capital it burned.
Bottomline
Traditional methods make it difficult to identify the net effect of the factors that impact Capital Efficiency. As you can see from the example above, a more effective evaluation parses the net changes in these factors and stacks them up against each other on a quarterly basis.
This more detailed approach allows for the effect of fast growth which can increase Churn and aggressive Upselling while simultaneously taking into account the slower scaling of fixed costs. Had we used a traditional method, we could have overlooked this fast-growth business that’s becoming more Capital Efficient. Using a more holistic approach provides valuable insights into Capital Efficiency.