Article at a Glance
- Cohorts are sub-groups of a population. By tracking your customer base by Cohort, you’ll learn about customer behavior. This will deepen your understanding of the details of your business while simultaneously providing a broader perspective, which you can use to improve the success of your business and increase profits.
- Cohort Analysis provides a visual representation in tables that allow you to compare a variety of metrics by Cohort. The other key element is measuring Cohorts by Life-month, rather than calendar months.
What is Cohort Analysis?
Cohorts are sub-groups of a population. In our practice of business analytics, we form Cohorts by grouping together a section of a customer base. The characteristic we use to group customers is the month in which they first became active with the business.
For example, all of the customers that first became active (i.e. started paying or using a product) during July 2019 are bucketed into and labeled the “July 2019 Cohort.”
Frequency of analysis: This Customer Cohort can be tracked on a weekly, monthly or quarterly basis using data points such as the amount of revenue generated, the number of transactions or interactions they had with a given product.
*Note: “Monthly” is the most common interval used because it gives a good balance of data fidelity and syncs up with monthly financial statements.
Three benefits of Cohort Analysis
- Deepens your understanding of the details
- Broadens your perspective of the bigger picture
- Enhances your leverage
What makes Cohort Analysis such a powerful tool?
By separating and tracking your customer base into Cohorts, you can identify how customers behave as they mature with your business or as your product matures over time.
INSIGHT: This analysis helps you deepen your understanding of customer behavior to help you improve their experience with your business. As a result of leveraging these insights, you can improve customer retention, revenue retention, and customer lifetime value as new Customer Cohorts are added over time. Ultimately, Cohort Analysis will improve your overall business success.
Understanding raw Cohort data
Cohorts’ data points are displayed in a table that takes on a triangular shape. Each Cohort is listed by name along the left hand-side of the table and Life-months are listed along the top. Data points for each Cohort are displayed from left to right along the Cohort’s row:
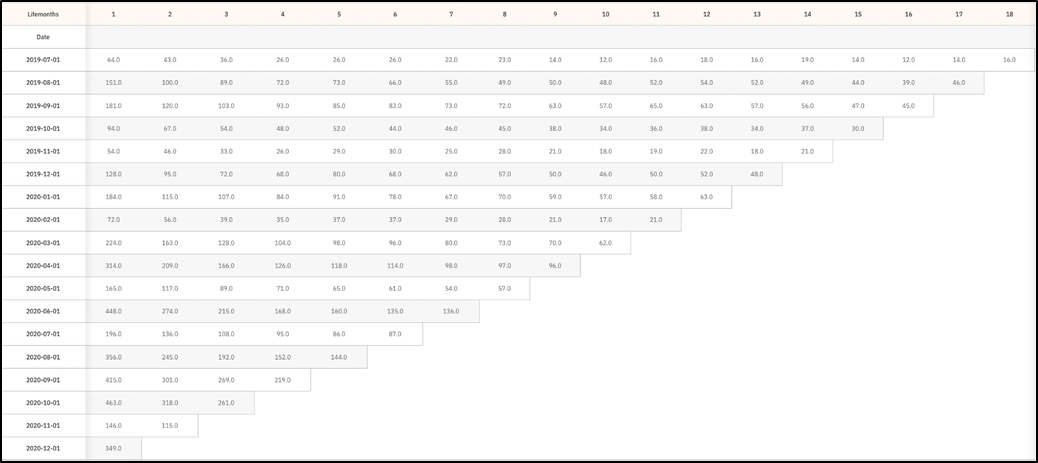
In the following example, the first Cohort is labeled, “July 2019.” That Cohort initially had 64 customers, and in Life-month Two (i.e. August 2019) that Cohort had 43 remaining active customers and in Life-month Three (i.e. September 2019) it had 36:
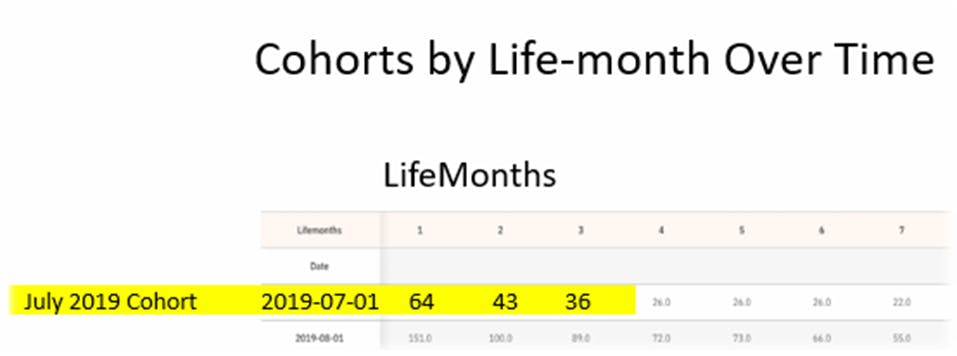
Leverage Use of Cohorts: Using the approach outlined above, you can compile tables that extract information from the revenue and transaction Cohort stacks to evaluate these other metrics for “Cohorts by Life-month Over Time.”
However, it’s possible for the initial customers of a cohort to spend or transact more activities in later months than that customer Cohort had during its initial month.
INSIGHT: It’s important to note that the total number of customers in future Life-months can never exceed the initial number of customers in that Cohort.
Takeaway
Cohort Analysis is a powerful tool that tracks sub-groups of a population, or Cohorts, to identify customer behavior and improve business success. By measuring Cohorts by Life-month, businesses can track metrics such as revenue and transactions over time. Cohort data is displayed in a triangular table that shows the number of active customers for each Cohort over time. Cohort Analysis can improve customer retention, revenue retention, and customer lifetime value.