What is CAC?
CAC. Those three little letters can strike fear into the hearts of founders everywhere. And for good reason - Customer Acquisition Cost can quickly spiral out of control, draining budgets faster than you can say "growth marketing".
Let's start with the basics. What exactly is CAC? Simply put, it's the total sales and marketing dollars spent to score a new customer. But it gets tricky when you try to define what counts as "sales and marketing spend". Here at Headline, we take a fully loaded approach. This means we incorporate any cost that has a role to play in securing new customers. Salaries, contractors, cute office dogs to boost team morale - it all gets piled on. This gives us the real unfiltered CAC.
Visualizing CAC Over Time
Now that we are on the same page about the definition of CAC, let’s look at the ways in which CAC can be visualized. The first way to do this is by charting out CAC by month (Figure 1)
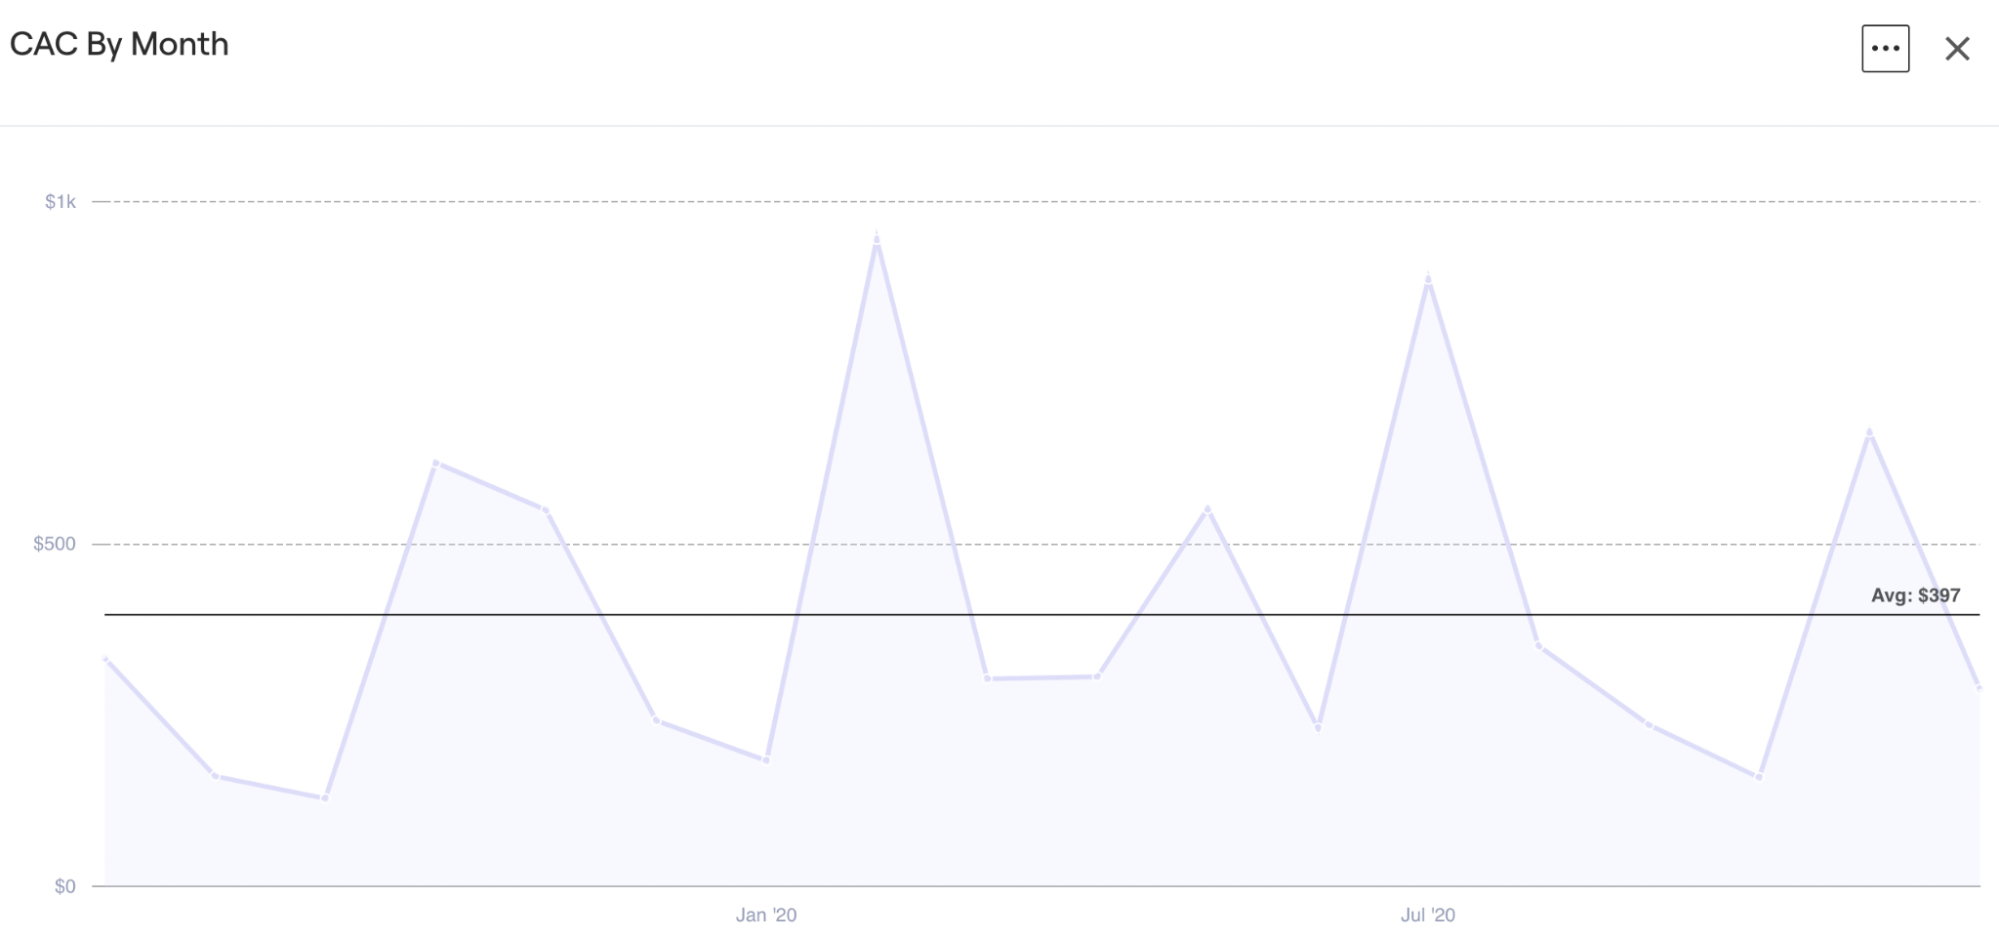
By charting out CAC by month we are able to see exactly how CAC has been performing over time as well as being able to identify any potential trends that may be developing.
The second way in which CAC can be visualized is to plot out the CAC with its corresponding S&M spend at a given point in time to see how they tango (Figure 2).
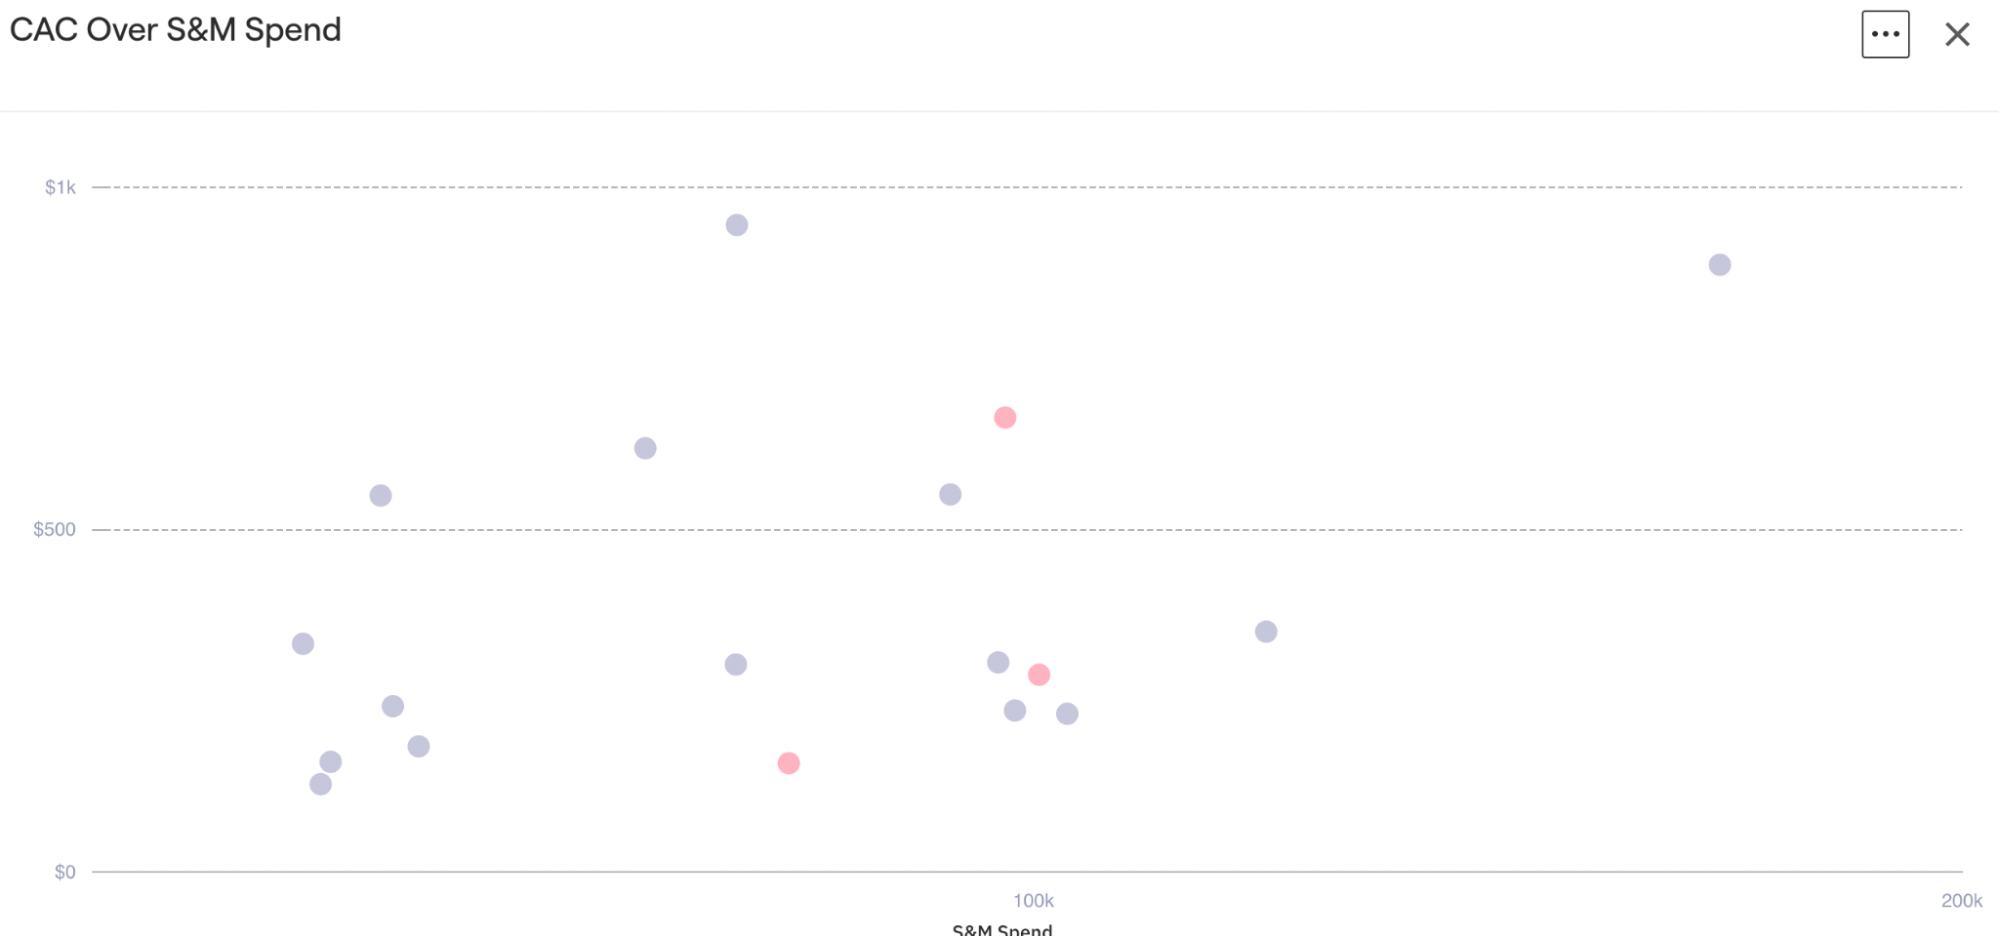
In this chart, CAC is plotted with the corresponding total S&M spend at a specific point in time (usually a particular month). With this chart we are able to see how CAC changes as S&M spend increases or decreases.
The Looming Specter of Rising CAC
This leads us to a question that we have to answer fairly regularly, “Why does CAC often increase over time?”.
In a nutshell, startups start out laser-focused on their core base who are easier to woo. But as marketing steps up, they eventually tap out prime customers - the early adopters - and have to work harder to capture fringe converts. More hand holding, more convincing, and ka-ching - rising CAC.
As the funding and resources of a venture grows, the company will be able to reach out to more of these users and introduce the product or service to them by spending more on their sales and marketing channels.Once you run out of early adopters you go after early majority, late majority and laggers, which usually require walk-throughs, more back and forth phone calls and generally just more time and resources to win them over. This will overall drive up CAC.
The key is having a big enough market and scalable tactics so spend and customers scale linearly. When both expand at the same rate, CAC holds steady. These are the businesses that venture capital firms like to scope out and work with. The real question, however, is whether an increasing CAC matters.
The main drawback is that CAC has a HUGE blindspot - it treats all customers equally regardless of revenue. What if bigger customers cost more to land? This is where Revenue Acquisition Cost (RAC) picks up the slack. Instead of cost per customer, RAC looks at cost per revenue dollar acquired.
The Secret Sibling CAC Doesn't Tell You: RAC
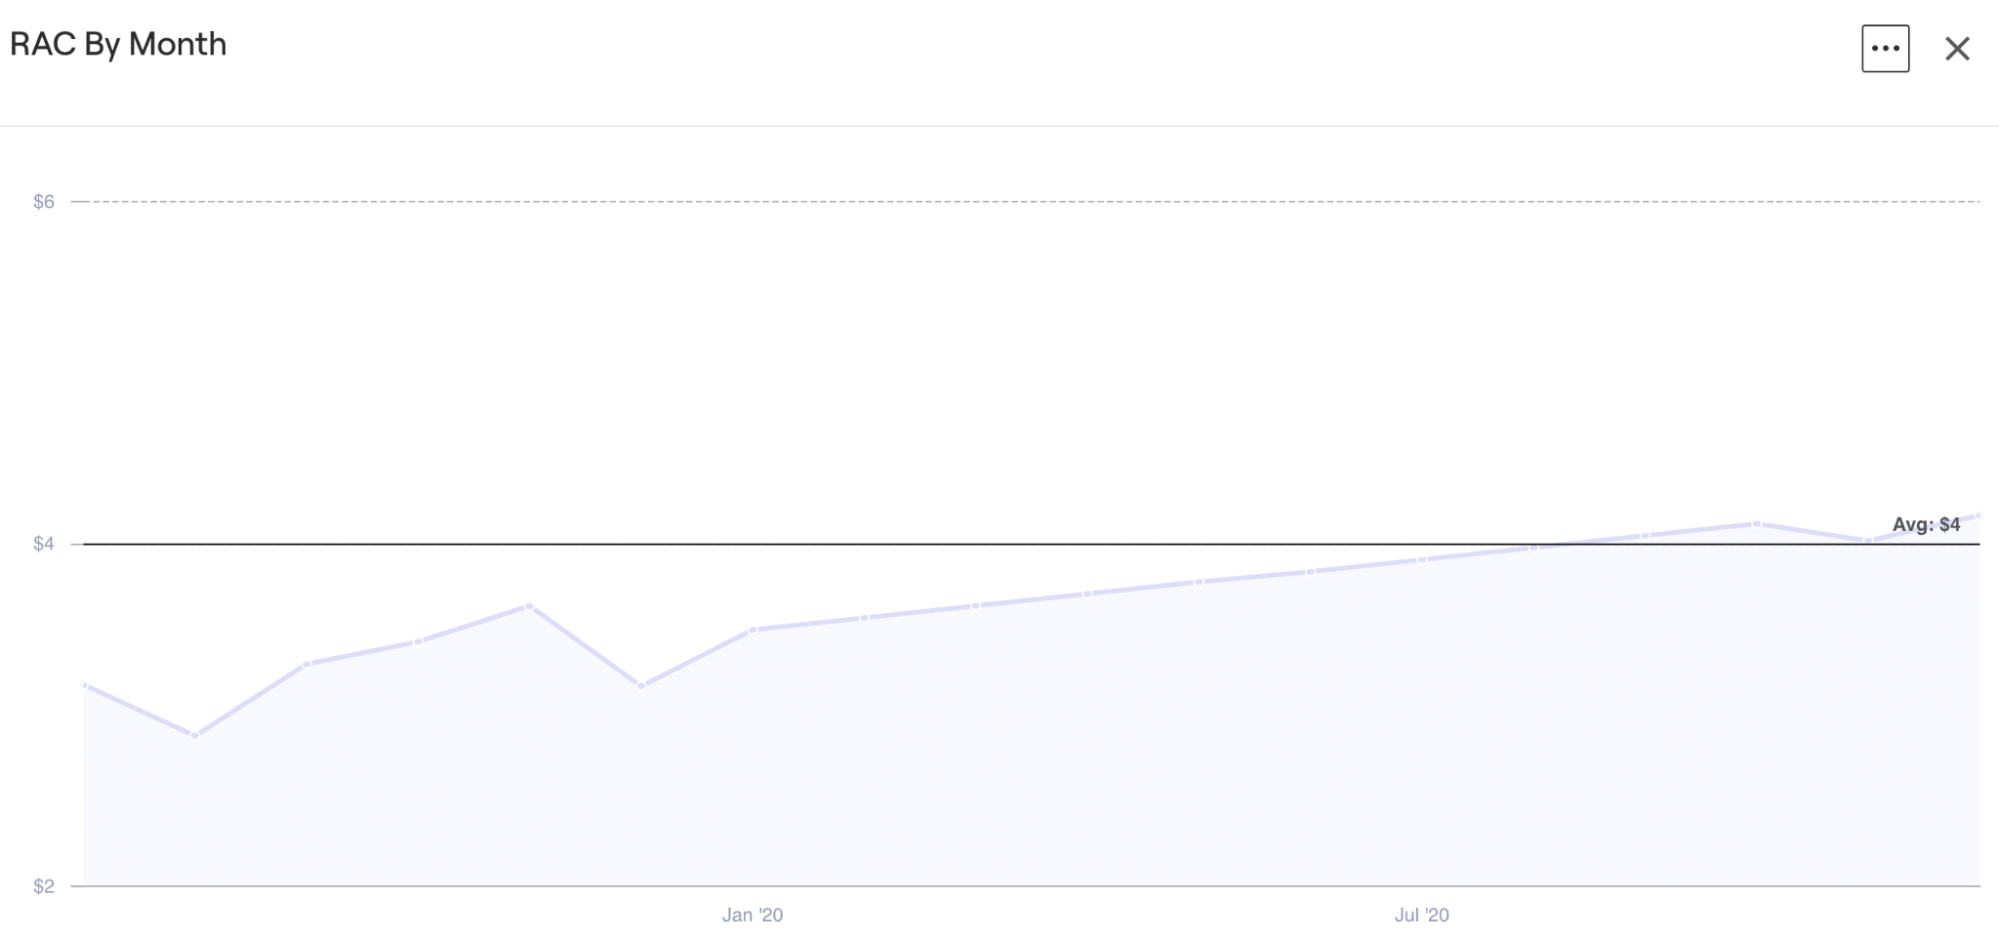
Revenue Acquisition Cost (RAC) is a different way to look at growth acquisition cost and is used to normalize for the size of new customers. RAC is the cost to acquire $1 of revenue from new customers in a given period (Figure 3).
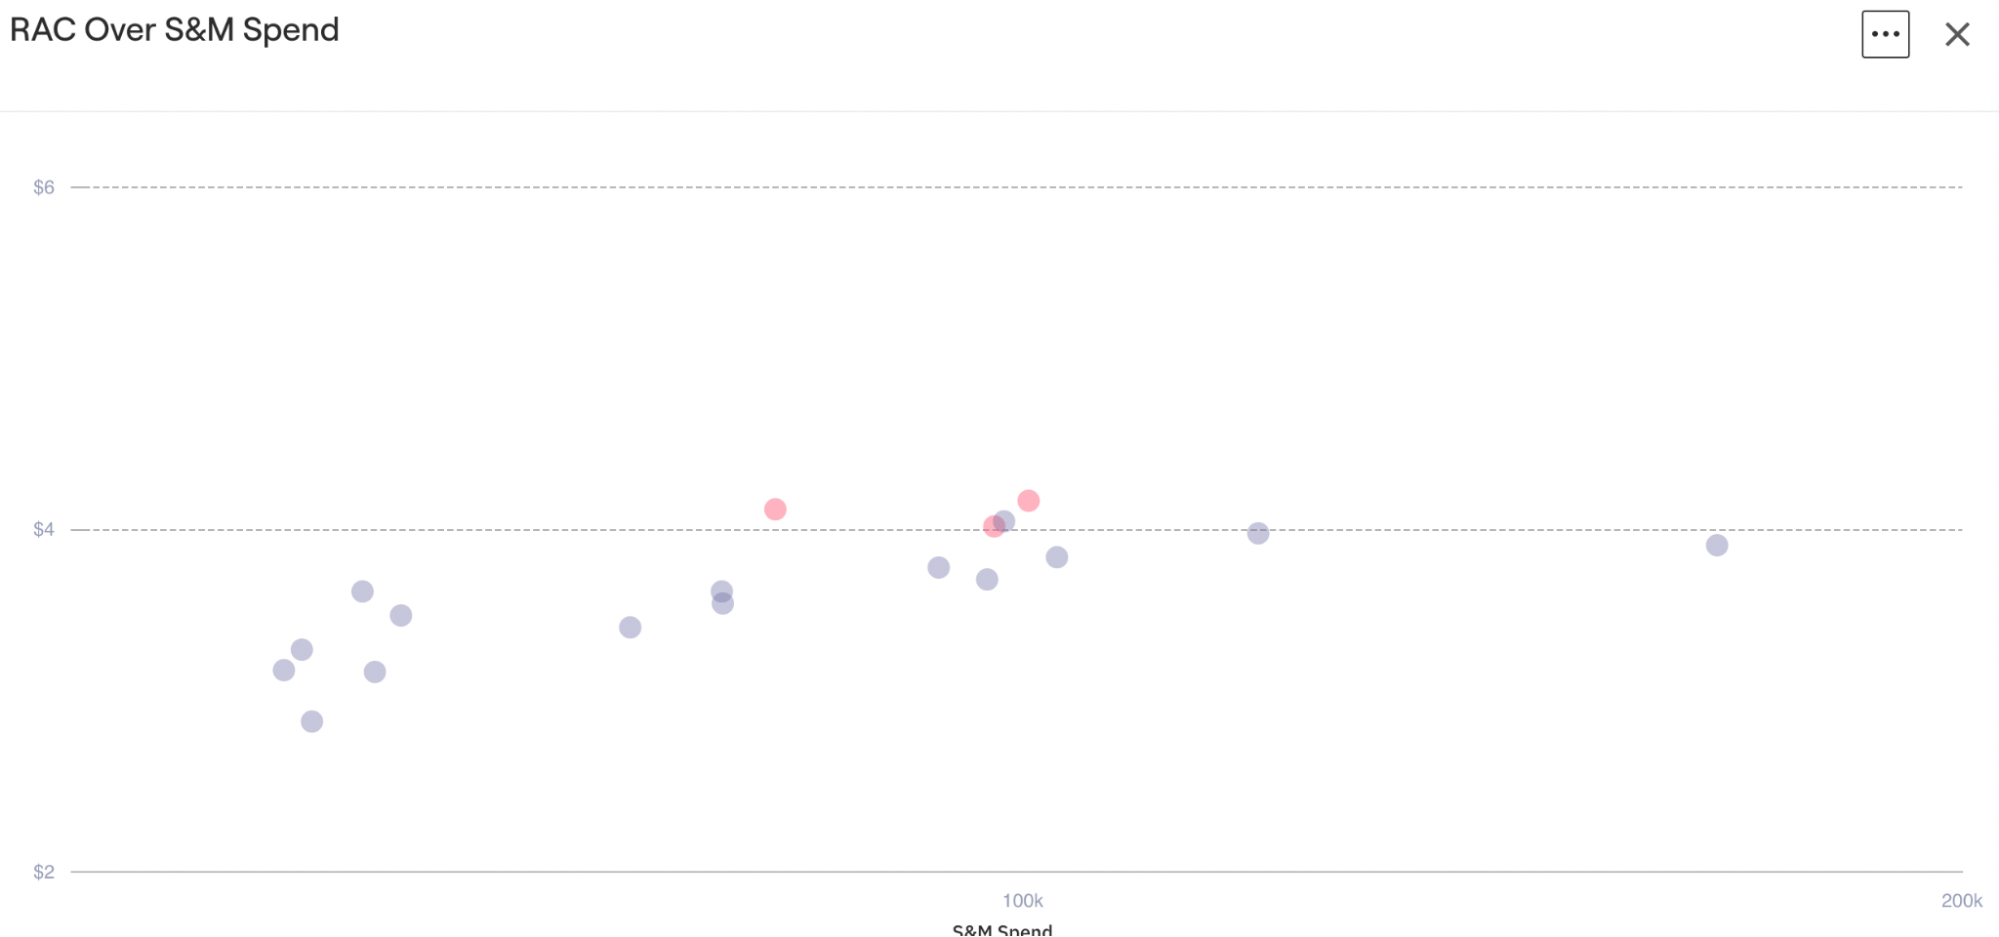
We visualize RAC identically to CAC, just that we do not map out the cost to acquire new customers but the cost to acquire a new dollar of revenue on the Y-Axis.
CAC or RAC? A real life case study
Imagine Company Bob’s Ice spends $10K to snag 1,000 customers at $10 CAC. Company Anna’s Creamery snags 100 customers for the same $10K, with an average CAC of $100. At first glance Bob’s Ice crushes Anna’s Creamery with a much lower CAC. But if you closely compare their RAC - Bob’s Ice customers only on average spend $1 per bag of ice, while Ann’s Creamery customers love to spend $10 per artisanal ice cream. They actually both ended up having identical $10 RAC since revenue scales accordingly. Thus - a $100 CAC isn't automatically bad if the revenue justifies it.
This comparison can also be made across different customer cohorts overtime, as a business will have varying customer sizes and CACs in each of their cohorts. It is therefore important to analyze RAC alongside CAC, especially for businesses that have large deviations in average contract size.
The Takeaway
The journey of demystifying CAC is an enlightening one, exposing several nuances. From understanding what it is, recognizing its gradually increasing trajectory, to realizing that a higher CAC does not necessarily connote negative implications, we have seen it all. Introducing RAC to the analysis presented even more insight. While CAC and RAC both provide valuable information, combining these aspects gives a fuller picture of a company's acquisition costs and illuminates areas of potential improvement or realignment.
As we continue to analyze and compare these metrics, it becomes evident that part of the magic of effective, data-driven decision-making lies in understanding not just how and why numbers change over time, but also recognizing the exceptions to the rules.
After all, exceptional insights often come from exceptions.