Why is Product-Market-Fit so important?
Product-Market-Fit tends to be elusive and tricky to define but it’s what VCs are all looking for because it’s critical to building a large, successful company. As a result, it’s super important for an early-stage start up to hit this target.
But first, what is it?
Product-Market-Fit is when a business creates a product or offers a service that’s positioned to a market segment that values it and consequently there’s a sustainable demand for it.
This juncture is an early indication of a start up’s long-term value.
Most ventures fail because they don’t reach this juncture. We’ve all heard about clever product ideas and innovative services that later fizzle out because there wasn’t sufficient demand. Even the most ingenious ideas can’t get a foothold when customers aren’t willing to make them part of their lives over the long-term.
Product-Market-Fit is Paramount
Entrepreneurs create products with the hope of finding Product-Market-Fit. When they hit this target, their start-ups are more valuable to VCs than those without it.
Once there’s Product-Market-Fit, it’s simply a matter of getting the product or service in front of the target customer base. This is where VCs can be most helpful. As a result, we at Headline focus on this elusive and highly variable metric.
Historically, Product-Market-Fit has been one of the most elusive things in our industry. This is the reason that Harry Stebbings’ interview of Brian Hale on 20VC Growth podcast resonates with the way we at Headline consider Product-Market-Fit.
Below is an excerpt of the relevant transcript beginning at 8:30 minutes:
Harry Stebbings: What is Product-Market-Fit to you then, Brian?
Brian Hale: Product Market Fit is Retention, and you can think about it as if you have a product and people use it. Think about it in terms of cohorts. So, in a mathematical way, you can say maybe, all the people who started for the first time using my product this month. Maybe we take, we are sitting here in March, so take the month of March, you take everyone who started using in March. Now, let's follow them forward in time and isolate that group of people who started using the product and let’s follow them. How many of them are still using this product on a regular basis in the following months?
Often, it takes a long time to know whether you have Product-Market-Fit because you actually need enough time to see whether Retention stabilizes. So we call these like J-curves. It’s basically when you graph it from the people who started, forward in time, and you see what percentage of that group is still around. Draw a point on the graph for as long as you need to. And if the graph goes flat or starts coming back up again, that’s called a smiley curve when it comes up again, that is really good! But even if it just goes flat, that means you have Product-Market-Fit.
Assessing product-market fit starts with cohorts and extends to month over month retention
The traditional way to evaluate Retention was to evaluate trends on a calendar month-to-calendar month basis. However, this does not provide a clear picture of customer behavior.
As a more effective alternative, Brian highlights the importance of evaluating Cohorts to understand customer behavior to see retention over time. Because it’s difficult to get a clear picture of numbers on a podcast, here’s a graph showing User Retention by Cohort:
- Each line represents a Cohort’s Retention over time. As churn within a cohort reduces, the lines flatten out.
- Time is measured by Lifemonths (not Calendar Months) to provide a more meaningful comparison across Cohorts
Fig: Customer Retention by Cohort
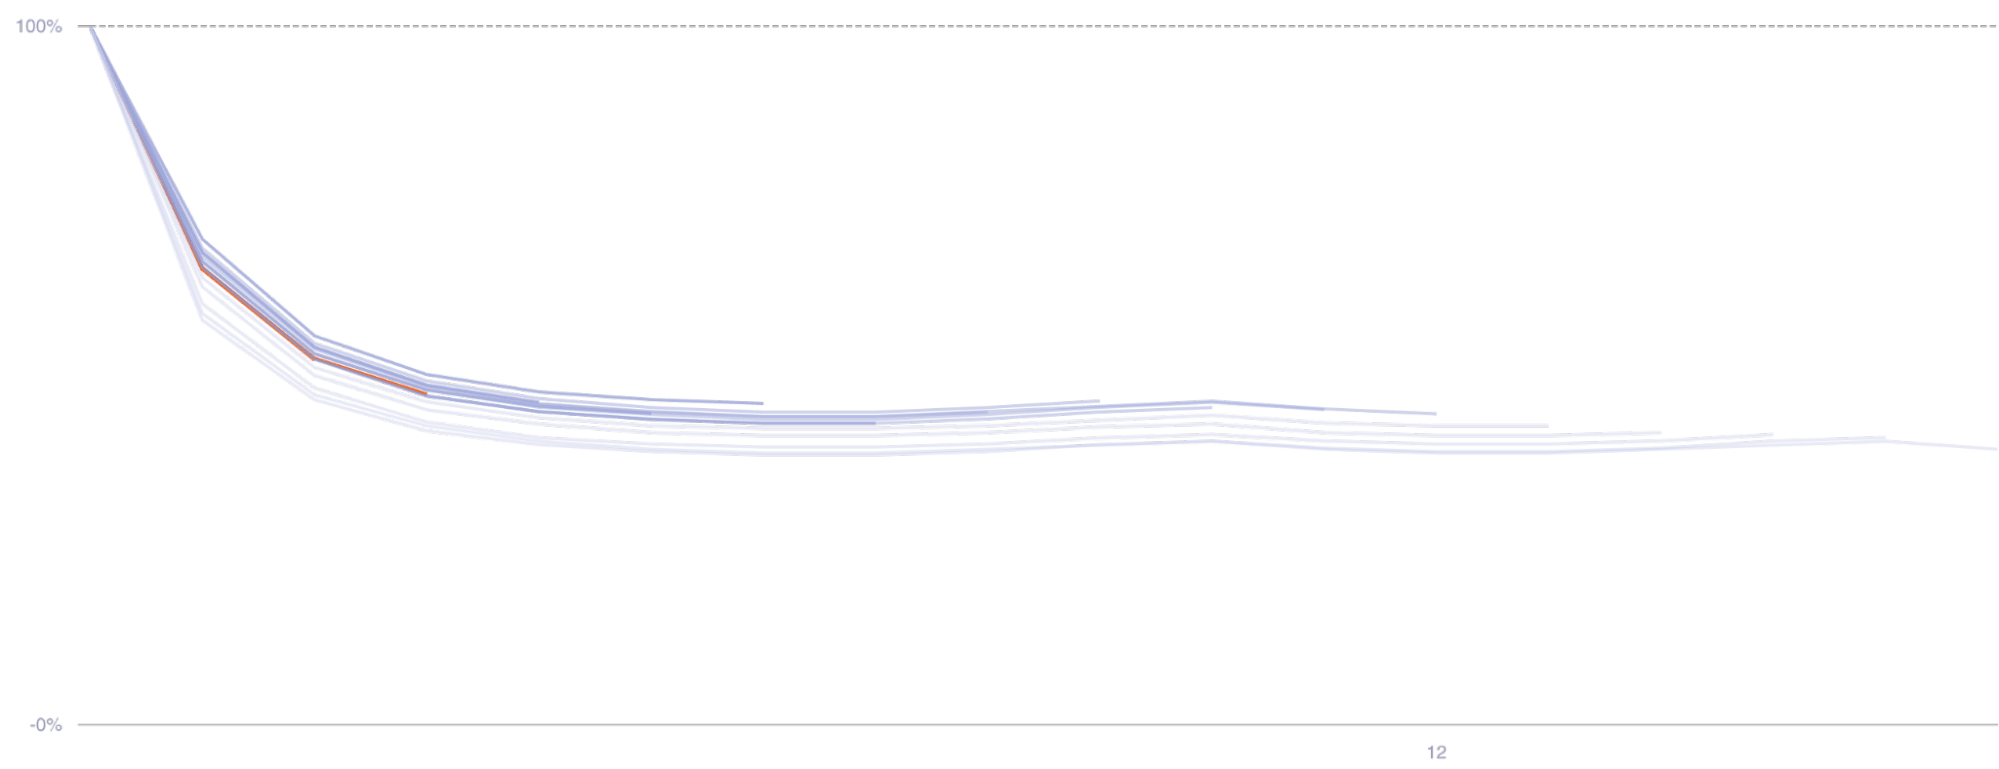
Where the lines flatten out indicates Product-Market-Fit because it shows the subset of customers in the Cohorts that continue to use the product or service long-term. This engagement indicates that the product or service has become part of those customers’ everyday lives.
We also like to compare lifemonth-to-lifemonth (MoM) Retention. It’s like the first derivative, comparing the amount of customers that retain from one lifemonth to the next.
When the lifemonth to lifemonth retention reaches and sustains at 100%, that’s Product-Market-Fit:
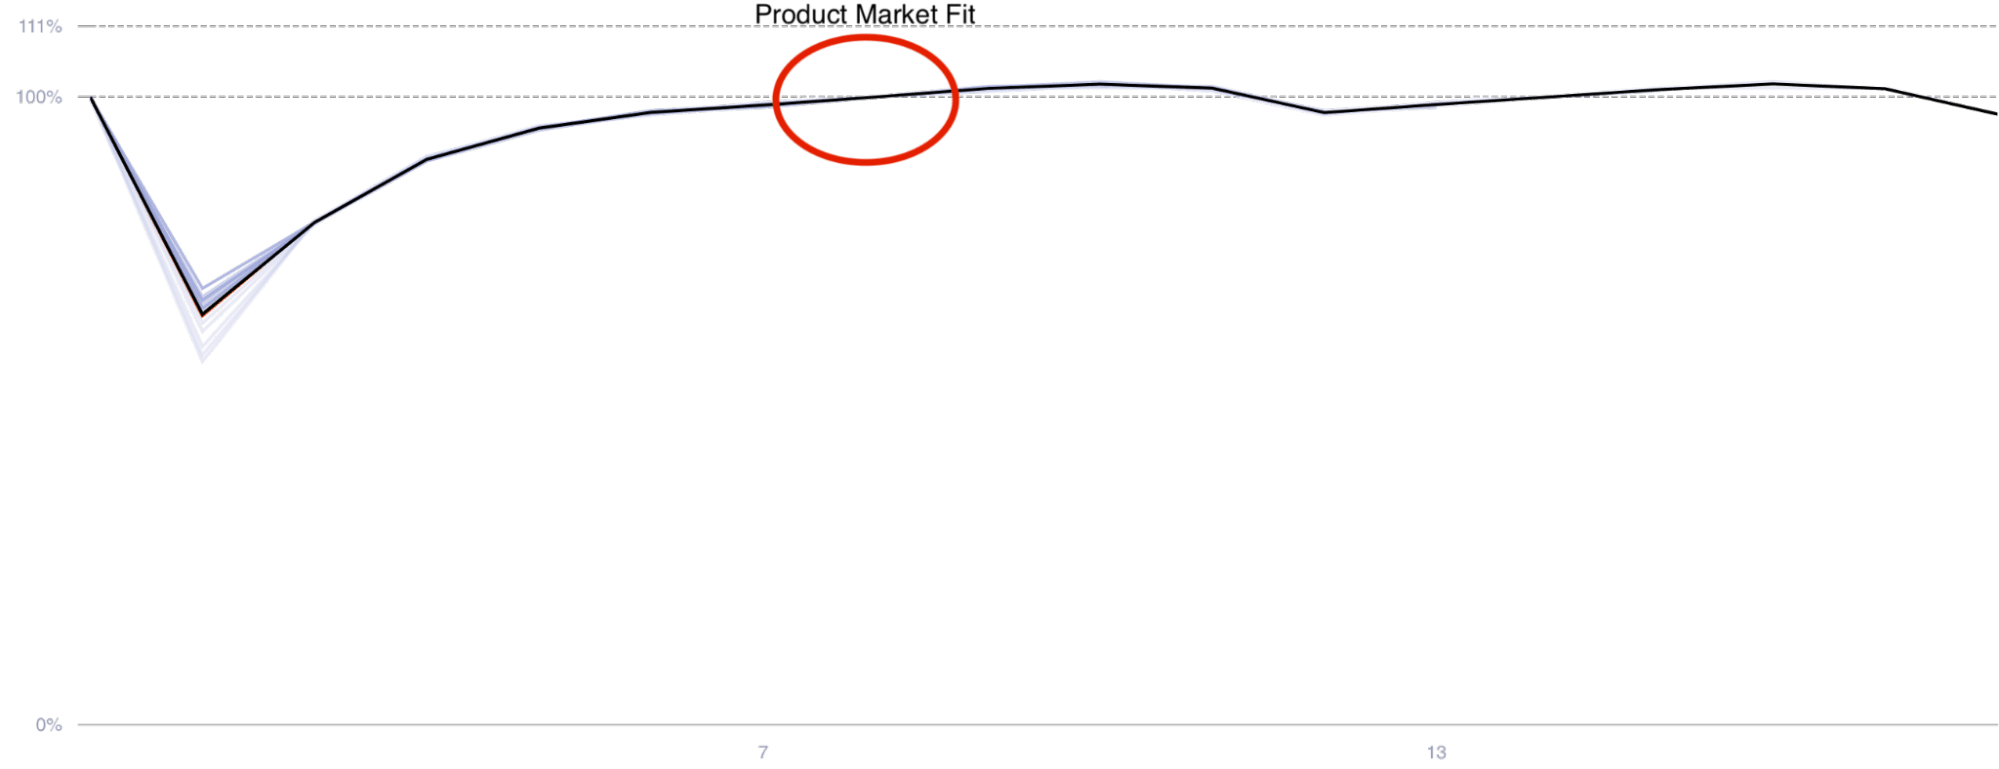
Like other VCs and operators, we look at where the lines flatten out but this horizontal asymptote is just the beginning for us.
Cohort behavior over the long term indicates stronger product-market fit
To further evaluate Product-Market-Fit, we also like to look at the behavior of the customers who retain into the long term. To do this, we parse out Cohort data further to illuminate usage or purchases as the Cohorts mature.
We do this because a stronger indicator of Product-Market-Fit is when retained customers gain more value as they mature with a product or service which can be seen by customers being more active or spending more with a business over time.
Alongside flattening retention, if Cohorts’ usage or purchases increase over time, this further confirms Product-Market-Fit. For these Cohorts, the asymptotes of the Cohort lines may become horizontal and then increase as the retained customers increase usage or purchases. Below is an example:
Fig: Monthly Seconds per User by Cohort
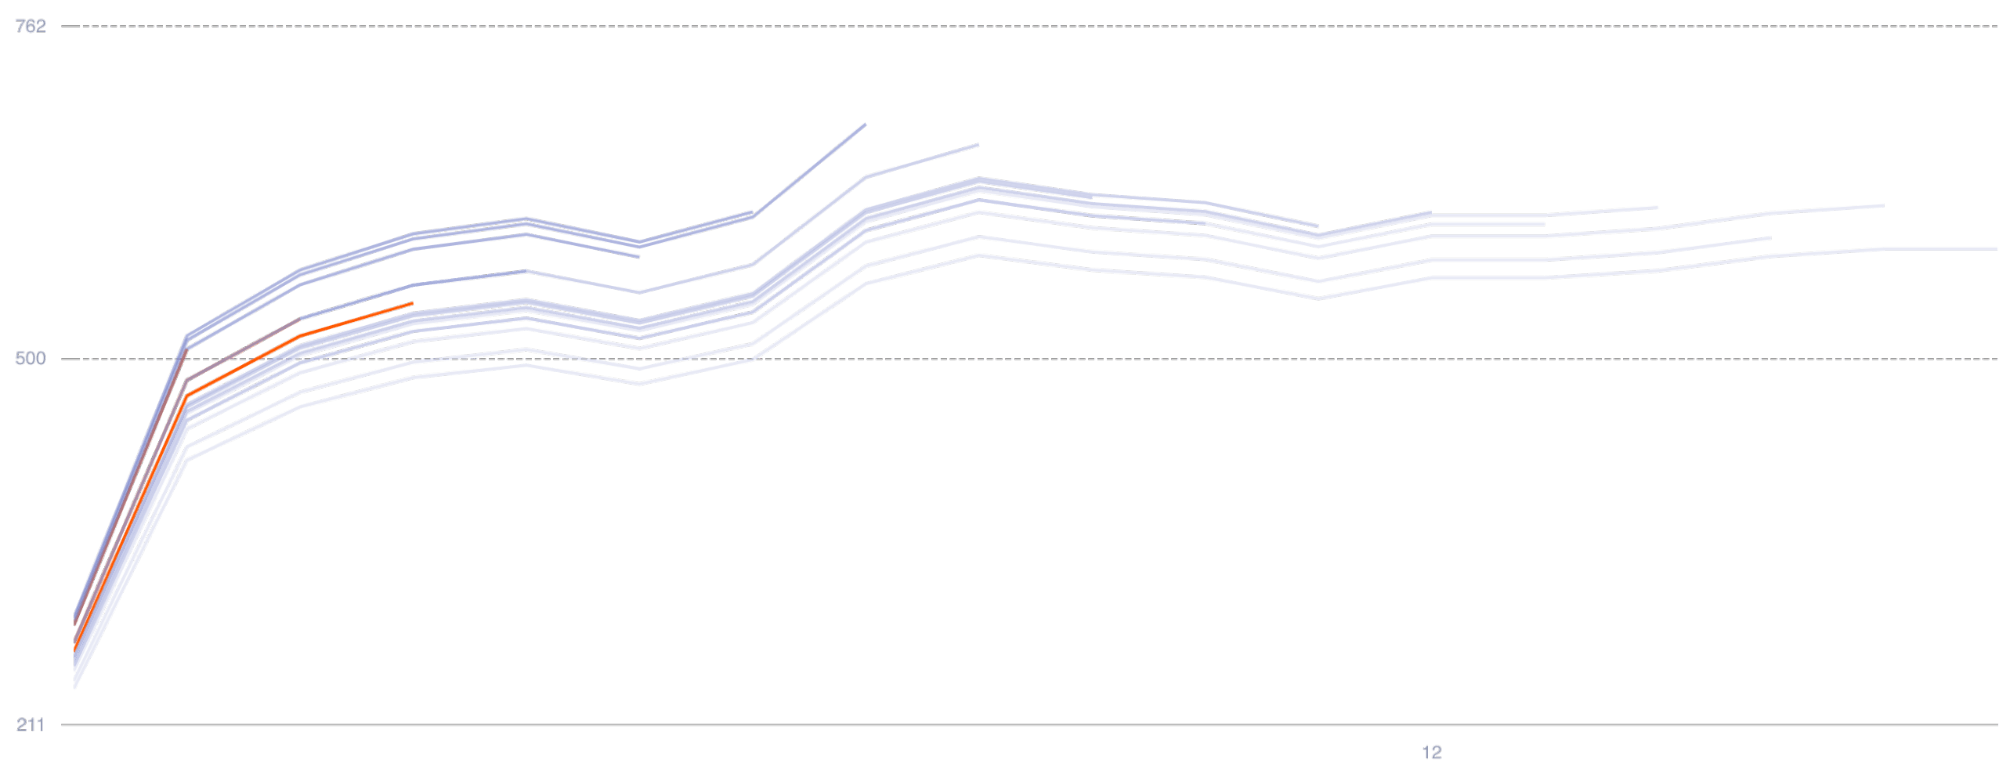
Note: Usage can be measured in multiple ways (e.g. seconds used, number of purchases made, money spent)
When retention asymptotes flatten out and the usage of the retained customer increases, is a good indication that the product or service is hitting a real nerve in the marketplace.
Lower asymptotes don’t always mean product-market fit is zero
Start-ups with lower Retention asymptotes should not be automatically dismissed as having low Product-Market-Fit.
Harry and Brian touch on this around 10:00 minutes. Here’s an excerpt:
Harry Stebbings: It can go flat until 1% retention. At what point does it need to go flat?
Brian Hale: The point it goes flat at as a percentage of the beginning, is how much Product-Market-Fit you have. Ok? That is how you quantify the amount of Product-Market-Fit [you have]. So I’d say it’s like binary. You have Product-Market-Fit - Yes/No - If you’re in 1% or 2% then I’d say that’s pretty much 0%.
Brian indicates that the asymptote quantifies the level of Product-Market-Fit, and that Retention with a low asymptote is the equivalent of having low Product-Market-Fit.
Of course, Retention with higher asymptotes is favorable. However, a low asymptote may not always be an indication of poor Product-Market-Fit.
Instead, it could be a reflection of a wide “Customer Acquisition Funnel.” For example, when there’s very little friction to start using a product or service such as with “Freemium,” which tends to create lower asymptotes (compared to expensive services such an Enterprise Software products that have $100,000 implementation fees).
What about freemium and consumer businesses?
If a Freemium service has a low asymptote, this indicates that a small percentage of customers remain. It does not mean there’s poor or no Product-Market-Fit, as it could be that the marketer is just incredibly good at getting customers to try the given product. Because wide acquisition funnels with low friction can have lower asymptotes, we do not automatically disregard these start-ups since this doesn’t provide the full view of what’s happening as Cohorts mature.
It’s possible that companies with low Retention asymptotes have solid Product-Market-Fit, just only with a subset of the customers they acquire. If so, we’d ask more questions such as:
- How expensive is it to acquire customers versus the customer lifetime value you earn from them?
- Is there enough of market size to sustain this low retention asymptote?
A business with a low Retention needs to churn through a large number of customers to achieve a large scale. For example, a company with a 2% Retention asymptote needs to churn through 50 customers for each one that it keeps:
2% Retention = 1 out of 50 customers remain (49 churn out)
Therefore, the question becomes whether the business would churn through its entire target market before it gets to a venture scale business ($1B+ public company).
The answer to these questions can’t be found in these graphs. Further examination is needed but it’s important to note that start-ups with low Retention shouldn’t automatically be dismissed as “leaky buckets” with no product market fit.