What is Retention?
Retention describes the percentage of active customers, revenue or other measurable customer interaction that recurs every period as a Cohort ages. Read here more about what a cohort is.
Evaluation of Cohorts
We look at Retention on a Cohort-by-Cohort level. You will see this in all cohort based metrics charts in Deepdive.
We also evaluate a Cohort’s data points in Life-month One in comparison to the same data points in subsequent Life-months.
These data points could entail measurements like the number of active customers, revenue generated, total transactions, or activities performed.
We express this comparison as a percentage. This percentage compares a Cohort’s values of each Life-month as a percentage of the value in Life-month One.
Here’s an example, shown in the table below. For a Cohort that starts with 100 active customers in Life-month 1, 50 in Life-month 2, and 30 in Life-month 3, the Cohort’s Customer Retention would be 100% in Life-month One, 50% in Life-month Two and 30% in Life-month 3.
Note: For customer retention, the subsequent Life-month retention value can never be greater than 100% since it’s impossible for a Cohort to have more active customers in subsequent Life-months in comparison to the first Life-month.
Customer Retention By Lifemonth
life-month | customers | retention |
|---|---|---|
1 | 100 | 100% |
2 | 50 | 50% |
3 | 30 | 30% |

Two Benefits of Cohort Analysis
1. Evaluate Behavior over Time
Cohort Analysis allows you to evaluate behavior of Cohorts as they age.
2. Compare Cohorts over Time
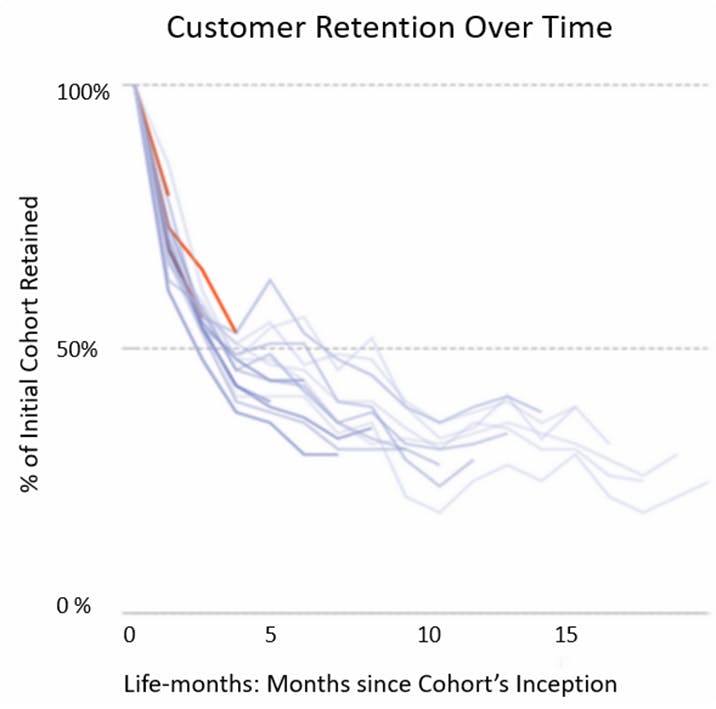
The main thing we at Headline look for when evaluating “Retention by Cohort” is whether Cohorts are showing asymptotic behavior. This effectively means that cohorts don’t decrease in value after a given Life-month.
In other words, we’re looking at what’s happening with the key data points (e.g. number of active customers, revenue generated, total transactions, activity interactions performed) for a given Cohort after a certain point in the Cohort’s life.
Using the example above, we can see the Cohort asymptote at around Life-month Ten at around 30%. This asymptote is important as it helps us forecast the number of customers, revenue, transactions, or activity interactions that a business can expect to have recurring (like an annuity) as future Cohorts are added. Below is a close-up of this area of the chart:

Our graph shows that the business could anticipate over the long-term to retain 30 of the original 100 customers that it first acquired during Life-month One.
MoM (Month-over-Month) Customer Retention
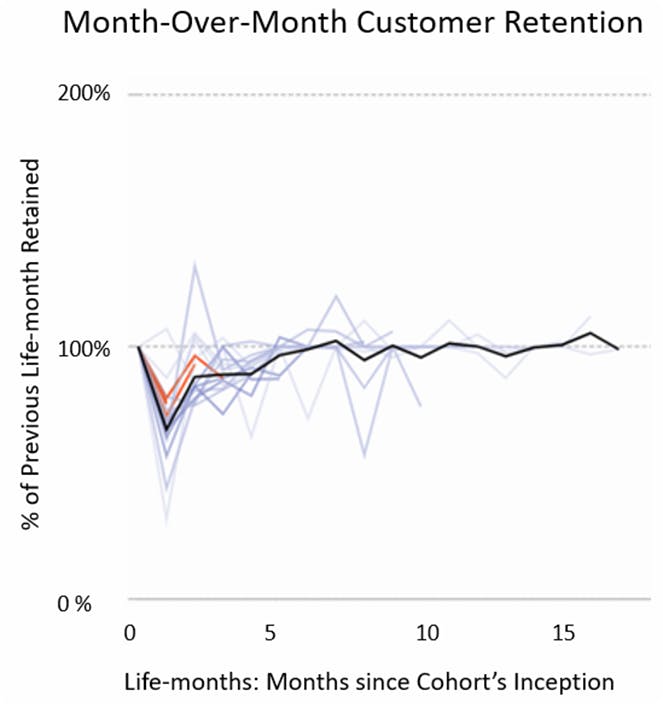
Another method used to identify the retention asymptote is to evaluate Customer Retention on a Life-month-to-Life-month basis.
Rather than comparing a Cohort’s data points only to Life-month One, we’d compare a Cohort’s Life-month values with its previous Life-months values.
MoM (Month-over-Month) Retention compares values in a month with the previous month. In a sense, it’s the first derivative of the Retention by Cohort Method.
A Cohort reaches its retention asymptote as the Cohort stabilizes, which can be seen where the line flattens out. In the example below, the Life-month-to-Life-month values stabilize near the 100% mark.
This leveling indicates that the number of customers, revenue generated, transaction or activity counts are not expected to decrease further as the Cohort ages.

Your Retention Is Your Company’s Report Card
Retention calculation may appear straightforward, but as highlighted earlier, it can quickly become complex due to various calculation methods such as month-over-month retention or first-lifetime retention.
However, when it comes to cohort-based calculations like retention, the details are what matter. The main goal is to identify whether cohorts are showing asymptotic behavior, which indicates that the number of customers, revenue, transactions, or activity interactions are not expected to decrease further as the cohort ages.
By gaining a deeper understanding of retention calculation, you'll feel more confident in evaluating your company's performance and predicting your customers' expected lifetime values.